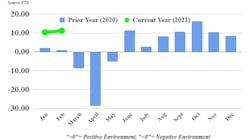
FTR’s Trucking Conditions Index climbs
FTR’s Trucking Conditions Index (TCI) for February, as reported in the April issue of Trucking Update, improved to 11.23 up from the January 10.37 reading. The February TCI was the highest since the record reading in October 2020. Strong capacity utilization and freight rates along with stable freight volume offset surging diesel fuel prices, which finally eased in late March after weeks of several months of increases. The near-term outlook for trucking is very strong with the TCI expected to deliver double-digit positive readings beyond Q2 and to remain in positive territory through 2022.
Details of the February TCI are found in the April 2021 issue of FTR’s Trucking Update, published March 31, along with additional analysis on why government data on historically lean retail inventories can be misleading unless you dig deeper. Beyond the TCI and additional commentary, the Trucking Update includes data and analysis on load volumes, the capacity environment, and rates. FTR also publishes ongoing publicly available analysis on the impact of COVID-19 on freight transportation at ftrintel.com/coronavirus.
“You could hardly devise better market conditions for trucking companies as demand is robust in both the consumer and industrial sectors and lingering labor-related challenges due to the pandemic are keeping a lid on capacity,” said Avery Vise, vice president of trucking, FTR. “We do not expect any noticeable easing in this environment until this fall, and even when that occurs, we do not anticipate that conditions will stabilize as quickly as they did in late 2018 and 2019. The outlook is not without risks, including shortages and disruptions in the supply chain. However, even those risks arguably have an upside by potentially bolstering freight demand over a longer period.”
The TCI tracks the changes representing five major conditions in the U.S. truck market. These conditions are freight volumes, freight rates, fleet capacity, fuel price, and financing. The individual metrics are combined into a single index indicating the industry’s overall health. A positive score represents good, optimistic conditions. Conversely, a negative score represents bad, pessimistic conditions. Readings near zero are consistent with a neutral operating environment, and double-digit readings in either direction suggest significant operating changes are likely.
