M&R cost per mile rose nearly 9% in 2025: ATRI study
Key Highlights
- Carrier costs per mile increased by 3.4% in 2025, outpacing inflation and driven by higher fuel, tolls, and maintenance expenses.
- Maintenance & Repair costs rose 45% since 2019, with regional differences influencing regional operational expenses.
- Fleet aging and delayed replacements have led to increased miles per truck and higher maintenance costs, emphasizing the need for strategic lifecycle planning.
- Fuel prices surged from $3.74 to $5.35 per gallon in 2025, adding approximately 20 cents per mile for trucks with 8 mpg efficiency.
- Tariffs on steel, aluminum, and tires contributed to higher parts and tire costs, with ongoing uncertainty affecting future expenses.

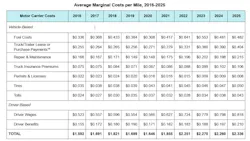
According to the American Trucking Research Institute (ATRI), carriers’ total average marginal cost per mile reached $2.33 in 2025, a 3.4% increase year over year. Versus the pre-pandemic times of 2019, CPM rose 37.5%. That outpaces the 26% uptick in U.S. inflation over the same period.
Fuel costs stayed about flat YOY at 48 cents, something that absolutely will not be said next year. In August 2025, an average gallon of diesel in the U.S. cost $3.74; this August it’s $5.35. A truck getting 8 mpg is now paying 20 cents more per mile.
The study, called “Analysis of the Operational Costs of Trucking: 2026 Update,” included data from more than 182,000 tractor-trailers, or 5.2% of the total U.S. combination truck population. They accumulated nearly 15 billion miles.
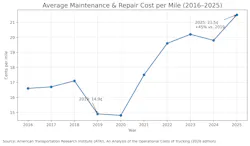
Tolls saw the biggest jump—5 cents—for a 13.2% increase, followed by Maintenance & Repair at an additional 2 cents per mile, or an 8.6% increase. M&R costs have increased 45% since 2019.
Companies also experienced more frequent breakdowns in 2025, and that means more expensive emergency roadside service calls. In 2024, the average span between breakdowns or unscheduled repairs was 38,249 miles; this declined to 36,891, a 3.6% change. The Less-than-Truckload sector, where shorter routes allow the trucks to stop at terminals more often, went 49,884 miles between breakdowns or unscheduled repairs. Truckload fleets were at 32,894 miles, and specialized fleets lagged far behind at 27,722 miles.
Average maintenance & repair cost per mile by region:
- Midwest: 21.4 cents
- Northeast 22.1 cents
- Southeast: 19.8 cents
- South Central: 19.4 cents
- West: 21.9 cents
Other factors driving costs up
Section 232 tariffs on steel, aluminum, and other materials are believed to have helped drive up the cost of repair parts, resulting in higher M&R. The Supreme Court ruled in February that the separate reciprocal tariffs did not meet International Emergency Economic Powers Act (IEEPA) standards and struck them down. ATRI said if those are replaced, the issue of higher parts prices would be exacerbated.
While the parts price hikes increased M&R, technician labor was down 0.4% in Q4 2025 vs. Q2024. ATRI predicts labor to stay flat through the year. And early data from carriers in the first half of 2026 indicate M&R was only up 2.4%, down slightly from the same time last year.
Tariffs were also blamed for tires being up 6.4%. And while early 2026 showed tire costs down nearly 5%, though that data does not include the disruptions stemming from the conflict with Iran and Strait of Hormuz closures. Oil and tire prices are closely tied together, and because of uncertainty around tariffs and oil market stability, ATRI concluded that tire costs will stay high into 2027.
More miles, fewer new trucks
ATRI noted that unfavorable freight volumes in 2025 led to “a significant number of already-purchased trucks” to stay parked. At the same time, truck lease/purchase payments continue to increase—3.6% from 2024 to 2025, and 61% since 2019. Class 8 orders softened in the last two years—after hitting record demand in 2021, driven by the pandemic freight boom.
Where maintenance is done
In 2025, almost two-thirds (64.4%) of fleet repairs and maintenance were completed by diesel technicians in-house, a rise of 4.6% over 2024. Fleets with more than 100 trucks skewed slightly higher (up to 68%), while fleets with 5-100 trucks performed about 55%. Even those fleets with under 5 trucks managed to do 42% of maintenance in-house.
Among ATRI’s respondents, the average truck age was 3.6 years in 2025, a slight increase from 3.4 years where it had stayed from 2022. As fleets delayed replacements and increased asset usage, the average annual miles per truck also increased from 82,677 miles to 85,991, a 4% jump. That’s still 17% lower than 2016, when average annual mileage was about 104,000.
The thing to consider here is that carriers’ replacement cycle is around 7 years, according to ATRI, with trucks accumulating 634,000 miles over that time. And the older a truck is, the higher the maintenance costs.
The question fleets must ask is if maintenance costs are lower or higher than acquiring a new truck. Brian Antonellis, SVP at Fleet Advantage, stressed that the key is to find a balance between maintenance and replacement costs they can live with.
“When a fleet decides to reduce the average replacement quantity, they need to understand the increase in R&M that will occur,” he offered. “The two cost lines we need to focus on are fuel and M&R, as they drive the majority of the asset-based variable cost. Ensuring that you have flexibility in your end-of-life decisions is critical to finding balance in the cost of your fleet.”
Everyone sees the fuel variability when driving by any gas station; maintenance costs are more nuanced. Figuring a Class 8 truck running 100,000 miles per year, Antonellis said that M&R costs start at 2 cents per mile ($2,000 total) in the first year, and grow to 16.5 cents ($16,500) in the sixth year. The procurement expert noted that these costs do not account for increased parts costs tied to inflation.
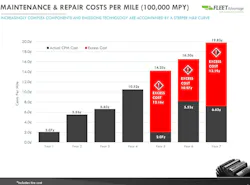
Along with less maintenance, newer trucks also have fuel efficiency benefits.
Things get more complicated with MY2027, as the low-NOx compliant engines will drive truck costs up, as well as add complexity. While dealerships will be trained up on handling potential issues related to the new aftertreatment heating systems, these would be new problems to in-house technicians, and it will take even experienced diesel techs some time to troubleshoot them efficiently. The EPA is allowing a certain number of pre-EPA 27 engines to be sold next year, allowing some customers to kick that can down the road a little longer.
The operational cost report's sources
ATRI’s report compiles data from several sources. In addition to data from the American Trucking Associations (ATA), Bureau of Labor Statistics, and ATRI’s own survey efforts, the report also factors in:
- Fuel costs from the Energy Information Administration (EIA)
- Truck payments from Omdia Automotive and ACT Research
- Maintenance costs from Decisiv, ATA's Technology & Maintenance Council, Fullbay, and Motor Information Systems
About the Author
 John Hitch
John Hitch
Editor-in-chief, Fleet Maintenance
John Hitch is the award-winning editor-in-chief of Fleet Maintenance, where his mission is to provide maintenance leaders and technicians with the the latest information on tools, strategies, and best practices to keep their fleets' commercial vehicles moving.
He is based out of Cleveland, Ohio, and has worked in the B2B journalism space for more than a decade. Hitch was previously senior editor for FleetOwner and before that was technology editor for IndustryWeek, and managing editor of New Equipment Digest.
Hitch graduated from Kent State University and was editor of the student magazine The Burr in 2009.
The former sonar technician served honorably aboard the fast-attack submarine USS Oklahoma City (SSN-723), where he participated in counter-drug ops, an under-ice expedition, and other missions he's not allowed to talk about for several more decades.